Turbidostat: Building a UI
Published:
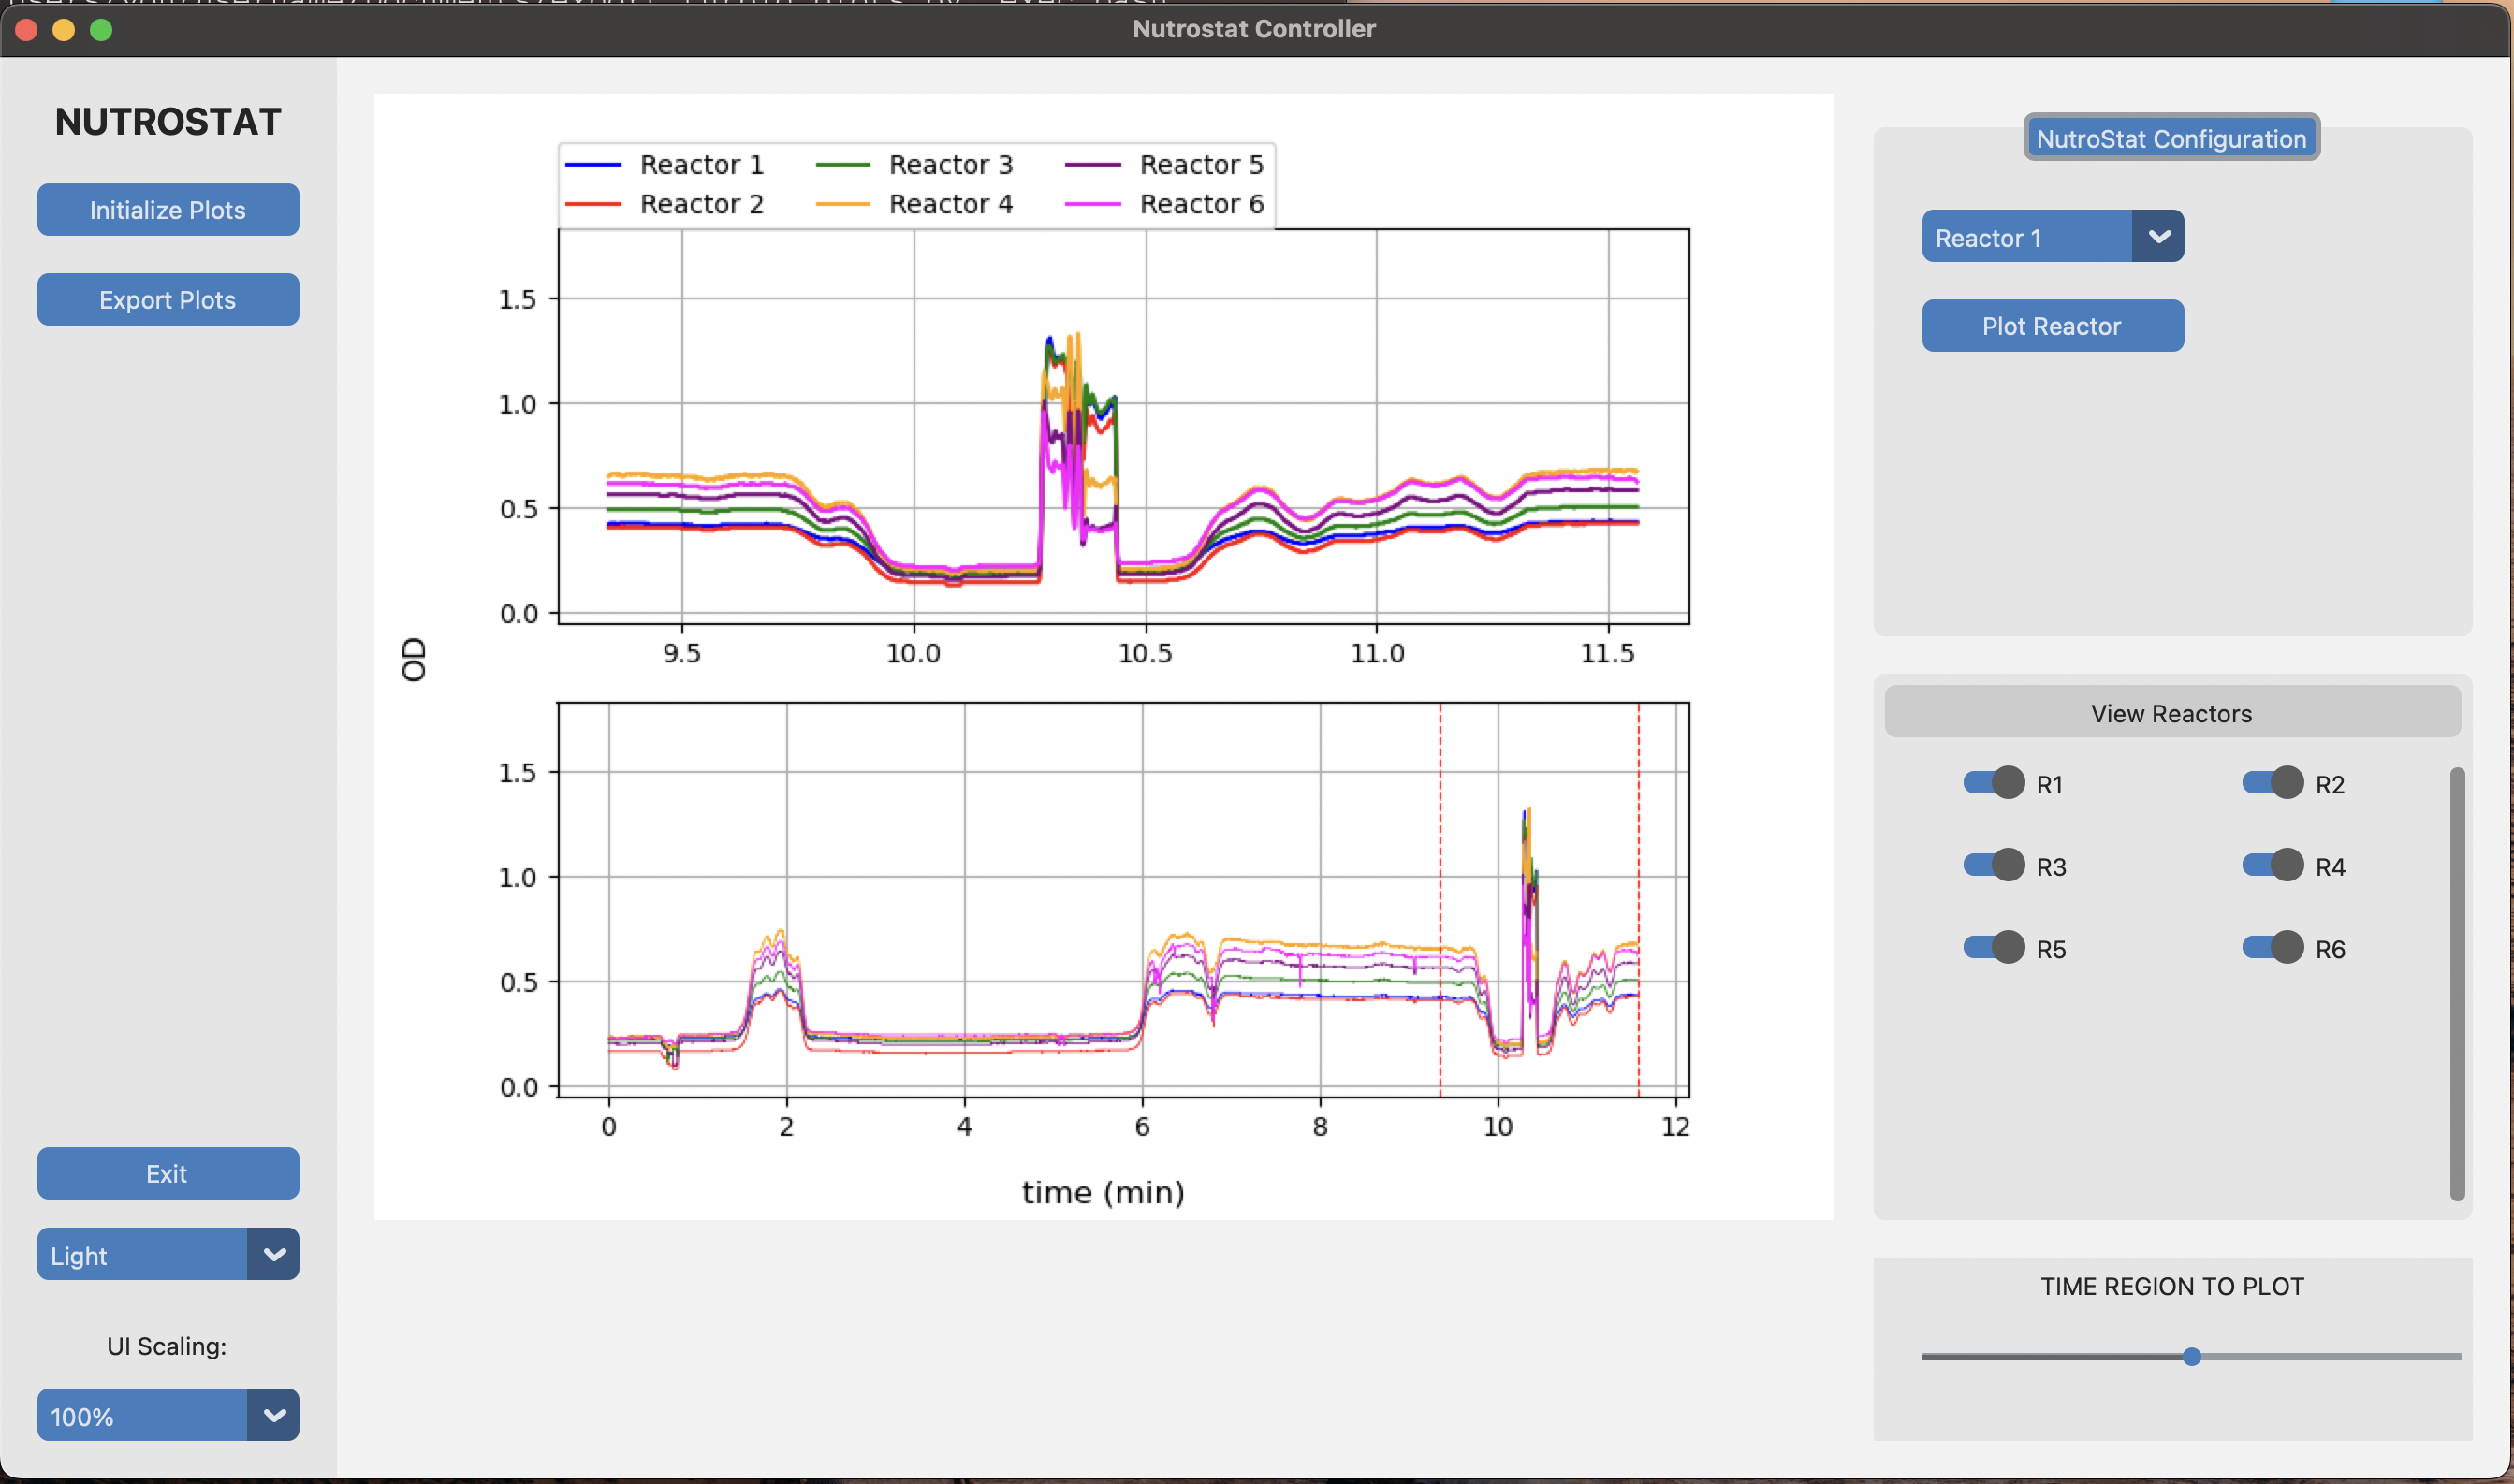
It would be nice to be able to see the data of the bioreactor in real time, and it would be useful to use that data and control the machine if necessary. I used customTkinter library for python, which is a wrapper package of tKinter, which itself is a wrap of javascript snippets to make a nice UI. This makes UI design as simple as calling a selection of classes to draw frames, buttons, switches, sliders, and plots. We can even display animated plots to display data in real time.
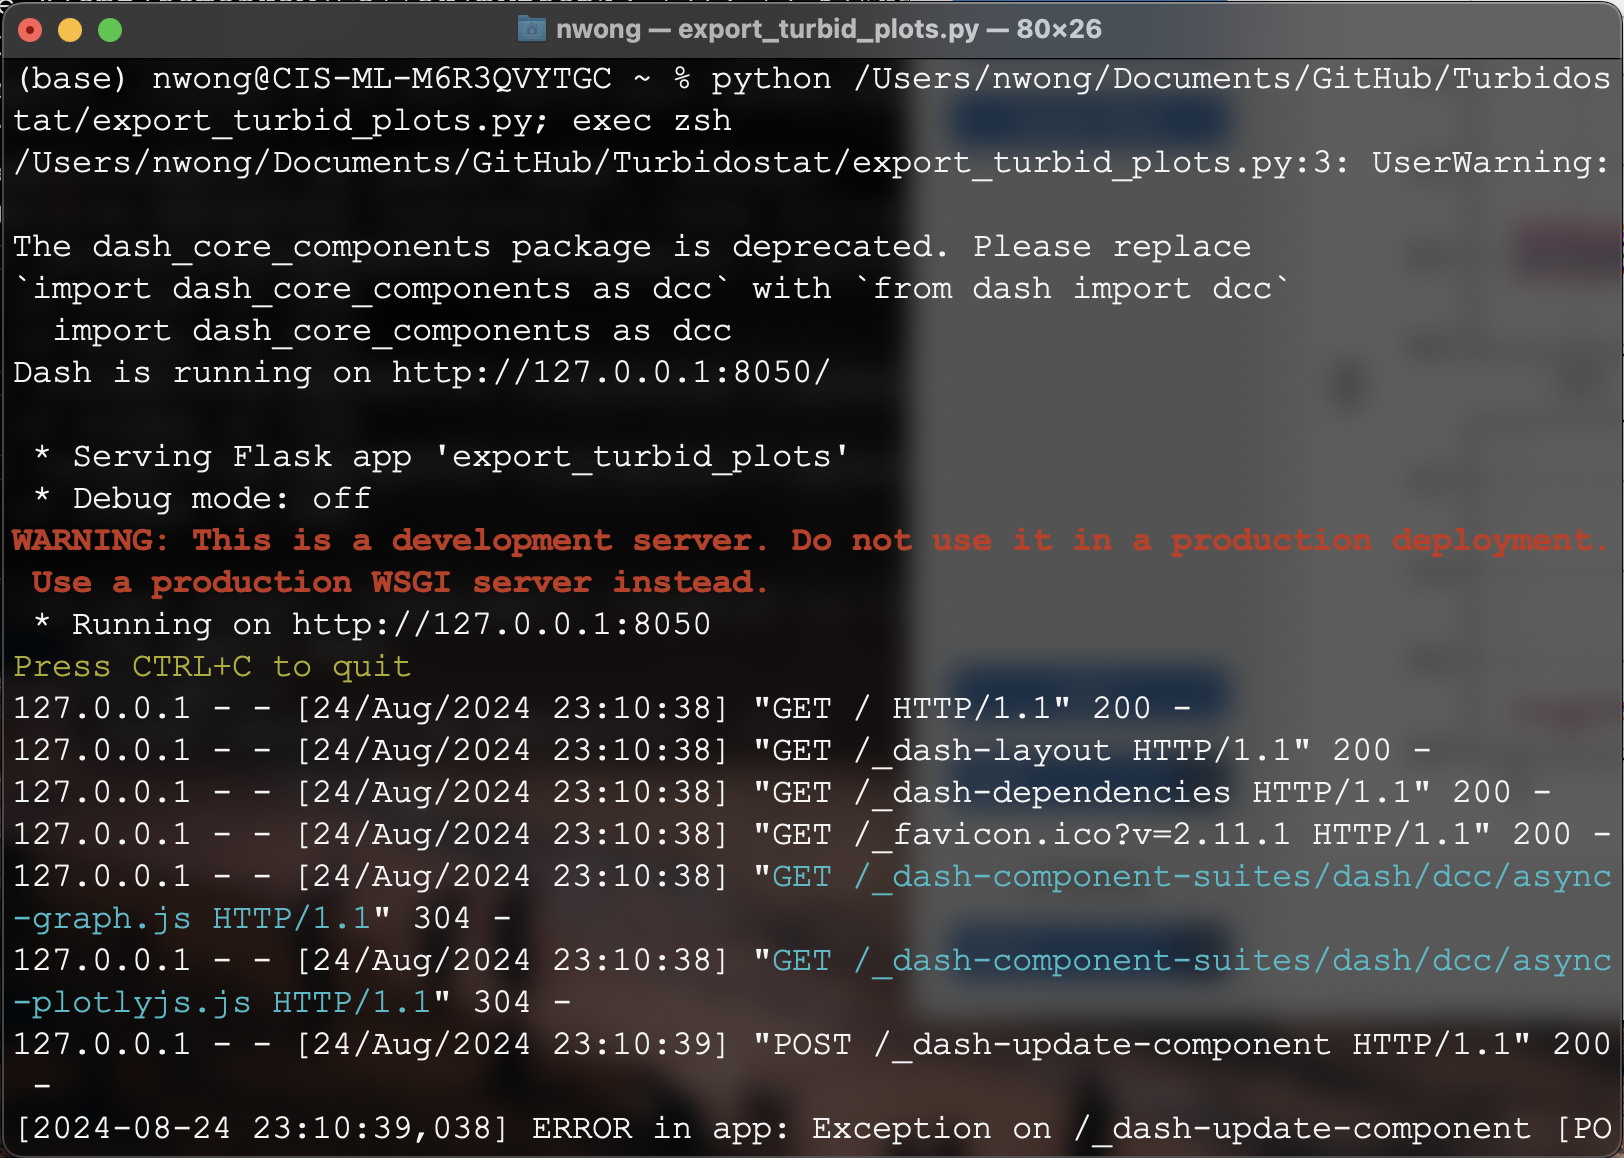
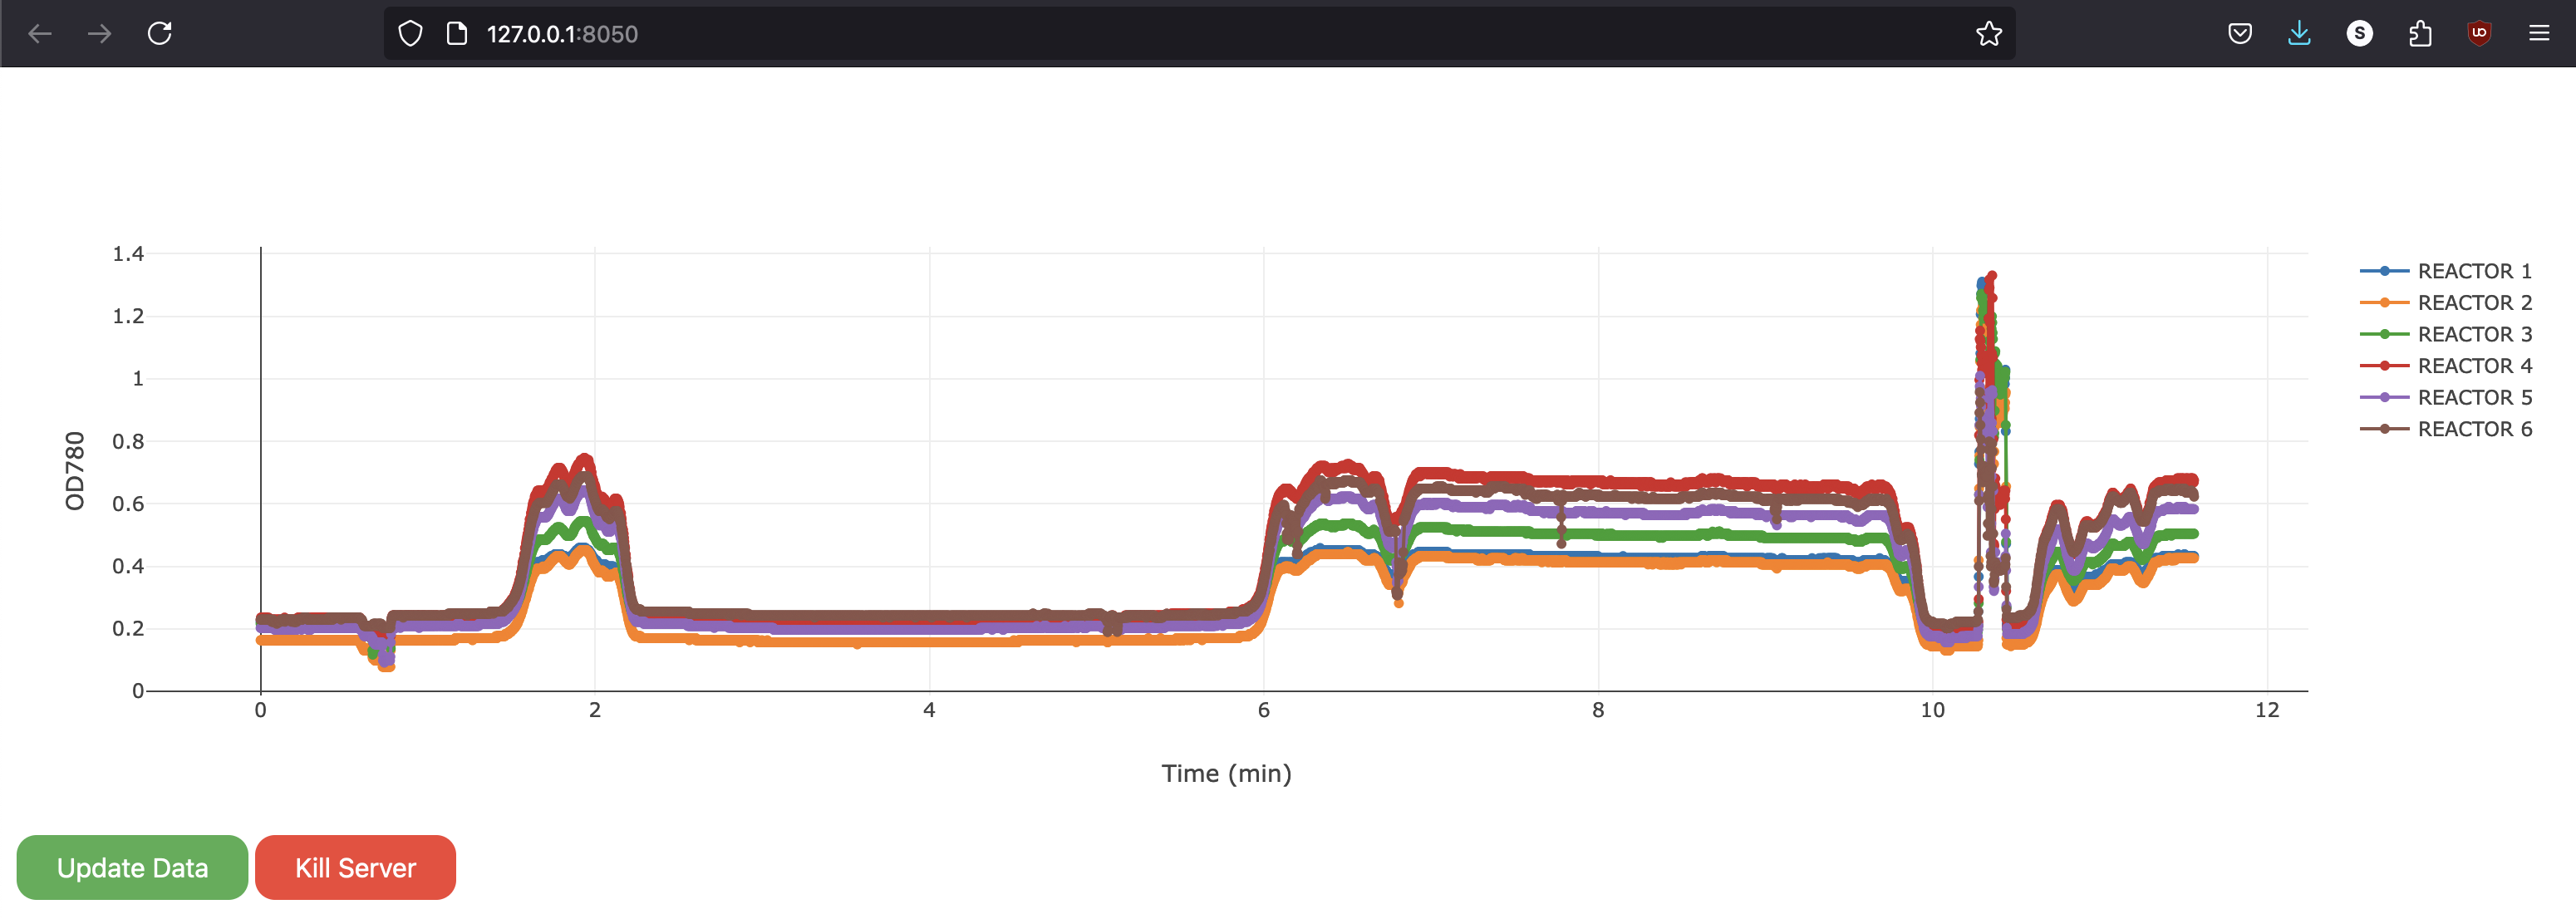
I’ve coded the export button to generate a dash interactive plotly server in case something interesting happens in the experiment.